
Market Structure
The Real-Rate Trade: Why Gold Moves When Bond Yields Do
For two decades the gold price could be read off an inflation-linked bond screen. Then, somewhere after 2022, the relationship stopped behaving — and the argument about why has become the most consequential debate in the metal's market.
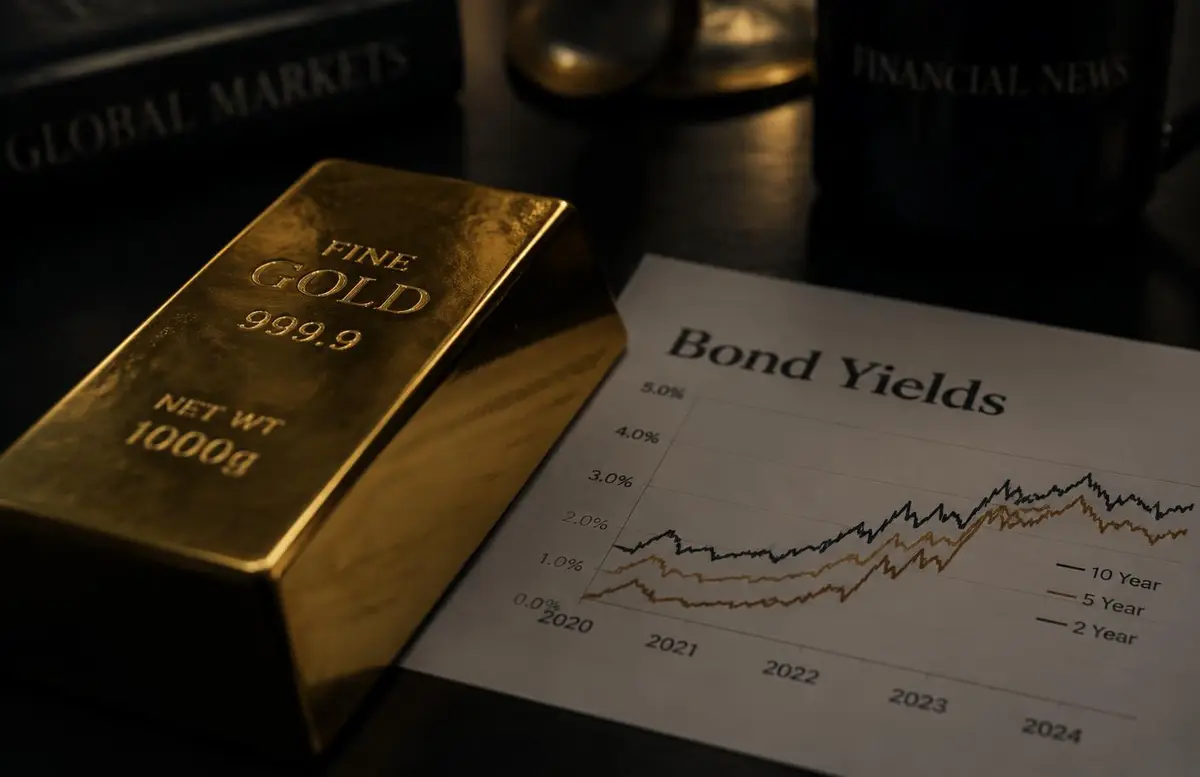
For most of the past two decades, a trader wanting a view on gold did not need to know anything about mines, refineries or jewellery. It was enough to watch the yield on a ten-year inflation-linked government bond. When that yield fell, the metal rose; when it rose, the metal fell. The relationship was tight enough to be traded as a spread, hedged as a spread, and explained on a single slide. It was a rare example of a multi-trillion-dollar market appearing to obey a single, simple command. This predictability made gold a staple of macro-economic modeling, where it was treated less as a commodity and more as a pure play on the inverse of the US sovereign real interest rate. For an entire generation of market participants, this was the bedrock of bullion analysis, providing a clear and reliable signal in an otherwise noisy financial landscape.
That slide is now out of date. Between 2022 and the middle of this decade real yields climbed to levels not seen since before the financial crisis, and gold, which the model said should have fallen hard, did not. It went up. The failure has forced a market that had grown comfortable with one variable to rebuild its account of what actually sets the price. This reconstruction process has revealed a much more complex and globalized set of drivers, moving away from a US-centric model and towards one that incorporates geopolitical risk, sovereign reserve management, and price-insensitive physical demand from emerging economies. The era of the one-variable gold model is effectively over, replaced by a messier reality where interest rates are just one term in a larger and more volatile equation.
This shift represents a fundamental challenge to the Western institutional consensus on gold. For years, Western analysts have dismissed gold as a 'barbarous relic' or a 'non-yielding asset' that only thrives when the central bank fails. The resilience of gold in a high-rate environment suggests that the metal has reclaimed its role as a systemic insurance policy, one that is becoming more valuable even as the 'opportunity cost' of holding it rises. To understand why the real-rate link broke, one must look deep into the mechanics of the bond market, the history of monetary crises, and the shifting geography of global wealth. The story of gold in the mid-2020s is ultimately a story about the changing nature of money itself and the search for an asset that sits outside the traditional credit-based system.
The opportunity-cost argument, stated plainly
Gold has no cash flow. It pays no coupon, issues no dividend and never matures. Whatever return it delivers has to come from the price. That single fact is the whole foundation of the real-rate framework: if a holder can own an equally safe asset that pays a positive inflation-adjusted return, holding gold has a cost, and the higher that alternative return, the higher the cost. This is the essence of the 'carry' argument that has dominated gold analysis since the 1970s. When the real return on a government bond is negative, the cost of holding gold is effectively negative as well, making the metal an attractive place to store purchasing power. Conversely, when real yields are high, investors are traditionally expected to rotate out of gold and into the safety of yielding paper assets.
Inflation-linked bonds make the comparison unusually clean. Their coupon and principal adjust with a published price index, so their quoted yield is already a real yield rather than a nominal one that needs an inflation forecast subtracted from it. That gives analysts something rare in markets: a directly observable measure of the thing the theory says should matter. In the United States, these Treasury Inflation-Protected Securities (TIPS) have become the global benchmark. The 10-year TIPS yield is the primary yardstick against which gold is measured. For two decades, the correlation was so strong that many trading desks treated gold as a 'spread product' against the TIPS yield, using leverage to capture the predictable inverse movements between the two assets. It was a model of elegant simplicity in a world of complex derivatives.
The mechanism also explains why gold behaves unlike other commodities. Copper responds to construction activity, oil to transport demand and spare capacity. Gold, of which almost everything ever mined still exists, responds to the terms on which people are willing to hold a stock. Its market is one of stock preference rather than flow consumption, and stock preference is exactly what an interest rate prices. Because the total above-ground stock of gold is estimated at over 200,000 tonnes—roughly 60 to 80 years of annual mine production—the supply side of the market is remarkably stable. It is the demand for this existing stock, influenced by the relative attractiveness of alternative 'safe' assets, that determines the price at the margin. When the cost of holding that stock rises via higher real rates, the price should, in theory, fall.
“Gold is not priced by what is dug up this year. It is priced by the willingness of everyone already holding it to keep holding it. It is the ultimate asset of stock preference.”
The mechanics of the TIPS breakeven
To understand the limits of the real-rate framework, one must understand how the real rate is calculated. It is not an atmospheric constant, but a derivative of two other volatile numbers: the nominal yield on a standard government bond and the 'breakeven' inflation rate. The breakeven is the market’s collective forecast of what inflation will average over the term of the bond, typically ten years. It is derived by subtracting the yield of an inflation-linked bond (like a TIPS) from the yield of a nominal Treasury of the same maturity. When analysts talk about 'real rates,' they are usually referring to this residual yield—the return an investor expects to receive above and beyond the rate of inflation. For gold, the distinction between a move in nominal rates and a move in breakevens is critical.
If nominal yields are rising because the economy is booming and the central bank is tightening to prevent overheating, gold usually suffers. The 'real' cost of holding the metal is rising, but the inflation threat is perceived as being under control. However, if nominal yields are rising because inflation expectations (the breakeven) are climbing even faster, the real rate can actually fall even as the 'headline' yield on your screen goes up. This is the ideal environment for gold: a world where the nominal return on cash cannot keep pace with the erosion of that cash’s purchasing power. In this scenario, gold acts as a hedge against the central bank's inability to control price levels, making it a sensitive barometer of institutional credibility and the future purchasing power of the dollar.
There is also a liquidity component to the breakeven that can distort the real-rate signal. During periods of extreme market stress—such as the 2008 financial crisis or the initial weeks of the 2020 pandemic—investors often sell TIPS to raise cash, causing breakeven rates to collapse. This can lead to a temporary spike in 'real rates' as measured by TIPS, even if the actual macro outlook for gold remains bullish. A sophisticated analyst knows to look past these 'liquidity spikes' in real yields, recognizing them as a breakdown in the bond market's plumbing rather than a fundamental shift in opportunity cost. These periods of technical disconnect often provide the best buying opportunities for long-term gold investors who understand the difference between market noise and structural shifts in the real return of currency.
Nominal - Breakeven
The core identity for calculating market-implied real rates
10-Year TIPS
The standard global benchmark for US real interest rates
Credibility Gap
When breakeven inflation rates rise despite central bank hikes
Liquidity Noise
Distortions in real rates caused by stress in the bond market
The precedents: 1970s and 2008
The real-rate framework was born in the fires of the 1970s. After the collapse of the Bretton Woods system in 1971, gold was allowed to float freely against the dollar. For much of that decade, the Federal Reserve was perceived as being 'behind the curve,' failing to raise interest rates fast enough to compensate for double-digit inflation. This resulted in deeply negative real interest rates for years on end, which fueled a massive bull market in gold that took the metal from $35 an ounce to a peak of $850 in 1980. The 1970s taught a generation of investors that gold is the ultimate hedge against a central bank that has lost control. It was only when Paul Volcker pushed real rates sharply positive that the gold bubble finally burst, beginning a two-decade bear market that lasted until the early 2000s.
The 2008 financial crisis provided a different kind of precedent, one that highlighted the role of gold as a systemic safe-haven. In the initial phase of the crash, gold actually fell as investors sold their most liquid assets to cover margin calls and losses elsewhere. This 'liquidity phase' saw gold and real yields disconnect briefly, as everything was sold for cash. However, as soon as the Federal Reserve launched Quantitative Easing and real rates plunged into negative territory, gold began a powerful multi-year rally. The lesson of 2008 was that gold can be a source of liquidity in a crisis, but it remains the preferred store of value once the monetary response to that crisis begins. It reinforced the idea that gold thrives when the 'promise' of a real return on government debt is broken by massive monetary intervention.
Comparing today’s market to these precedents reveals why the current situation is so unusual. In the 1970s, gold rose because real rates were negative; today, gold is rising while real rates are positive and relatively high. In 2008, gold rose as a reaction to a collapse in the financial system and massive easing; today, it is rising in the face of the most aggressive tightening cycle in decades. This suggests that the current bid for gold is not just a reaction to interest rates or a temporary liquidity shock, but a structural shift in how the world’s largest pools of capital view the safety of the US-led financial system. The metal is being bought as a hedge against the very architecture of modern finance, rather than just the day-to-day policy decisions of the central bank.
Furthermore, the 1970s taught us that the 'level' of gold matters less than the 'regime' of rates. Gold was able to sustain a decade-long rally because the market believed the Fed was permanently compromised. In the 2020s, a similar sentiment has emerged—not that the Fed is too slow, but that the debt burden of the US government is now so immense that positive real rates are mathematically unsustainable in the long term. Investors are increasingly viewing gold as a 'zero-duration' alternative to a bond market that may eventually be forced into 'financial repression' to manage the national debt. This macro-thematic bid is far more powerful than the week-to-week fluctuations in the TIPS yield, representing a long-term bet on the eventual devaluation of sovereign debt.
“In the 1970s, gold thrived when the Fed lost control of inflation. In the 2020s, it thrives because the market is starting to price in the long-term unsustainability of the fiscal system itself.”
The years the model worked
From roughly 2005 the fit was remarkable. Real yields ground lower through the financial crisis and the quantitative-easing years, and gold ran from the hundreds of dollars an ounce to a then-record above 1,900 dollars in 2011. When the Federal Reserve signalled the end of asset purchases in 2013 and real yields snapped higher — the famous 'taper tantrum' — gold fell by roughly a quarter in a matter of months. For nearly a decade, the relationship was so tight that you could predict the direction of gold with 80% accuracy just by looking at the direction of the 10-year TIPS yield. It was a golden era for macro funds who could trade the relationship with high conviction, confident that the two assets were tethered together by a shared economic reality and a stable set of marginal buyers.
The pandemic repeated the pattern in compressed form. Real yields collapsed into deeply negative territory in 2020 as policy rates were cut and inflation expectations recovered faster than nominal yields; gold set a nominal record above 2,000 dollars in August of that year. Nothing about the metal had changed. The cost of holding it had. The world was awash in liquidity, and the real return on 'safe' government debt had vanished, leaving gold as one of the few remaining stores of value that couldn't be printed by a central bank. The framework seemed invincible, surviving the most volatile year in market history with its predictive power intact, further cementing the belief among Western analysts that real rates were the only variable that truly mattered in the gold market.
Those episodes hardened the framework into something close to consensus. Bank research desks published charts with the gold price on one axis and inverted real yields on the other, and the two lines sat on top of each other with uncanny precision. Systematic funds coded the relationship into signals, and retail commentary reduced it to a simple slogan: gold goes up when real rates go down. By 2021, it was widely accepted that the only way for gold to reach new highs was for the Fed to return to zero rates or for inflation to spiral out of control. When the Fed began the most aggressive tightening cycle in forty years in 2022, the model predicted a brutal bear market for gold. The bear market never came, marking the start of a profound disconnect that has redefined the market for the current decade.
What broke after 2022
The break was not subtle. As central banks raised policy rates against the fastest inflation in forty years, ten-year real yields moved from below zero to comfortably positive — a swing of well over two percentage points in a very short period. On the old relationship, gold should have fallen substantially, likely back to the 1,200 to 1,400 dollar range. Instead it held its ground, then advanced, then set successive records in dollar terms. The two lines on the chart, which had moved in lockstep for fifteen years, suddenly diverged. Gold was no longer listening to the bond market. For the first time in a generation, the 'opportunity cost' of gold was rising, yet the demand for gold was rising even faster, creating a pricing paradox that left many Western analysts and macro funds baffled.
Rolling correlations tell the same story more precisely. The strongly negative correlation between gold and real yields that had characterised the preceding fifteen years decayed towards zero and, in some windows, flipped sign. Analysts who had built position sizing around the spread found their hedge had stopped hedging. In the past, a portfolio of long gold and short bonds was a classic 'neutral' macro bet; after 2022, that same portfolio became a source of significant volatility. The fundamental 'wiring' of the macro market had been rerouted, suggesting that the marginal buyer was no longer the Western hedge fund chasing a yield screen. Something deeper was happening in the structure of the gold market, moving the metal's price discovery away from the futures pits of New York and toward the physical markets of the East.
Three responses followed this disconnect. The first was to declare the framework dead, arguing that in a world of high inflation and geopolitical instability, interest rates are simply no longer the primary driver. The second was to insist it was merely delayed — that gold was in a 'bubble' and would eventually crash once the reality of high rates set in. The third, and the most useful, was to ask what other term in the equation had grown large enough to swamp it. This led researchers to look beyond the COMEX pits and the ETF flows of London, turning their attention instead to the central bank vaults of the East and the physical markets of Shanghai. The result was a new understanding of gold as a 'multipolar' asset, whose price is determined by a competing set of buyers with vastly different objectives and time horizons.
The official sector arrives
The most widely accepted explanation for the disconnect is that central banks became sustained net buyers on a scale the market had not priced. Official-sector demand had been positive since around 2010, when the reserve managers of emerging economies stopped selling, but from 2022 the annual totals stepped up sharply and stayed there. Central banks were no longer just 'diversifying' at the margin; they were engaging in a strategic accumulation of bullion that was largely indifferent to the daily fluctuations of the US bond market. This created a 'floor' under the price that the real-rate model could not account for, as these buyers were not motivated by carry or yield, but by the fundamental properties of sovereignty and safety in an increasingly fragmented world.
This matters because reserve managers are not yield-sensitive in the way a fund is. A central bank buying gold is not comparing it with an inflation-linked bond on a Bloomberg screen; it is deciding what fraction of its reserves should sit in an asset that no other government can freeze, sanction or decline to honour. That is a question about the legal and political properties of a claim, not about carry. In a world of increasing geopolitical friction, the 'insurance' value of gold has risen exponentially, far outweighing the 'opportunity cost' of the lost interest. For a central bank, gold is the only reserve asset that is not someone else's liability, and that property has become priceless in an era of financial warfare and the weaponisation of currency reserves. The bullion held in one's own vault has no counterparty, making it the ultimate defensive asset.
The freezing of a major central bank's foreign-currency reserves in 2022 made the question concrete for every reserve manager watching. A coupon is a poor consolation for an asset that can be rendered unusable by a decision taken elsewhere. This shift in the perception of reserve 'safety' has fundamentally changed the calculus for central banks in the Global South. Even if real rates on US Treasuries are positive, the 'political risk' of holding those Treasuries has risen. Gold, by contrast, is a neutral asset that requires no permission to hold and no counterparty to honour. This structural shift in demand has broken the link between gold and yields because the buyers are solving for sovereignty, not for return. As long as geopolitical tensions remain high, this official-sector bid is likely to remain a dominant and price-insensitive force in the market.
“Reserve managers did not decide gold had become a better investment. They decided that some of their other assets had become a worse promise. The real-rate model assumes the promise is always kept.”
Currency-hedged gold: Returns outside the dollar
The real-rate framework is almost always discussed in terms of US yields and US dollars. However, gold is a global asset, and for an investor in Tokyo, Frankfurt, or Ankara, the opportunity cost is defined by their local bond market and the stability of their local currency. This 'non-USD' perspective helps explain why gold remained so strong during the Fed's tightening cycle. In Japan, for instance, the Bank of Japan maintained a policy of Yield Curve Control for much of the period, keeping nominal yields near zero even as inflation rose. This meant that 'real rates' in Yen were deeply negative, providing a massive incentive for Japanese investors to buy gold. Consequently, gold hit all-time highs in Yen long before it did so in Dollars, a move that was largely invisible to Western analysts who only watch the US TIPS screen.
Currency hedging costs also play a critical role that is often overlooked in traditional models. A European institution that wants to buy US Treasuries to capture higher real yields must also pay to hedge the Euro-Dollar exchange rate risk. In recent years, the cost of this hedge has often been high enough to consume much of the yield differential, meaning that on a 'currency-hedged' basis, the real yield of a US bond for a European investor was actually much lower than it appeared on a headline basis. If the cost of the hedge is too high, gold—which requires no hedge and carries no currency risk—becomes the superior 'safe' asset for the portfolio. This 'cross-currency basis' is a technical but powerful driver of gold demand that the standard real-rate model fails to capture, as it treats all capital as if it were natively dollar-denominated.
Furthermore, gold acts as a 'neutral' currency in a world of volatile FX. When the major G7 currencies are all being devalued relative to the cost of living, gold becomes the 'denominator' that stays still. For investors in emerging markets with unstable currencies, gold is not a 'trade'; it is the only reliable form of long-term savings. The demand in these regions is driven by the failure of the local 'real rate' to protect wealth. As the number of countries experiencing high inflation and currency instability grows, the global 'floor' for gold rises, regardless of what the US 10-year yield is doing. This globalized demand is a primary reason why the US-centric real-rate model has lost its absolute authority over the price. The gold market has become a refuge for capital escaping a wide variety of local monetary failures, creating a diverse and resilient bid that transcends the US interest rate cycle.
Negative Real Yen Rates
Driver of record Japanese gold demand despite high US yields
Hedging Costs
Technical factor that makes gold more attractive to European allocators
Neutral Denominator
Gold's role as the steady anchor in a world of volatile fiat currencies
Emerging Market Floor
Physical demand driven by local currency instability
Positioning, open interest and the COMEX signal
While long-term trends are driven by macro factors and official buying, the day-to-day noise of the gold price is still largely a product of the COMEX futures market in New York. This is where 'paper gold' is traded, and where positioning data provides a window into the mind of the Western speculator. The most important tool here is the Commitment of Traders (COT) report, which disaggregates the market into categories like 'Managed Money' (mostly hedge funds and CTAs) and 'Producers/Merchants.' Managed Money tends to be highly sensitive to real rates and technical momentum. When real rates fall, these funds pile into long positions; when they rise, they liquidate. This activity often creates the short-term 'overshoots' in both directions that the real-rate model predicts. Understanding the 'crowdedness' of these positions is essential for timing entries and exits in the market.
Open interest—the total number of outstanding futures contracts—is the other crucial metric for assessing the health of a move. A rising price accompanied by rising open interest suggests that new money is entering the market to support the trend, indicating high conviction among buyers. Conversely, a rising price on falling open interest often indicates 'short covering,' where traders who bet against gold are being forced to buy back their positions to limit losses. Short-covering rallies are often violent but lack the durability of a move fueled by new long positions. By contrast, the 2023-2024 rally was notable for how little Managed Money positioning contributed to the initial move; the price broke out even as futures positions remained relatively modest, further evidence that the real driver was outside the traditional Western speculative complex and that the paper market was struggling to keep up with physical demand.
Understanding the role of 'Commercials' is also vital for a complete view of the market. These are the producers (mining companies) and merchants (bullion banks) who typically hold net short positions to hedge their physical inventory. When Commercials reduce their short position to unusually low levels, it often signals a market bottom, as it suggests that even the most pessimistic 'insiders' no longer see value in hedging at current prices. During the post-2022 disconnect, Commercials remained heavily short, yet were consistently steamrolled by the physical bid. This 'squeeze' on the Commercials is a rare event in gold history and highlights the sheer force of the structural demand coming from Asia and the official sector, which was able to overwhelm the traditional hedging mechanisms of the Western market. It marked a transition from a 'supply-driven' market to one driven by a relentless search for systemic safety.
Finally, one must watch for the 'positioning washout.' Because so much speculative money in gold is leveraged, a sharp move in the dollar or a surprise jump in bond yields can trigger a cascade of sell orders as funds hit their stop-loss limits. These washouts are the primary reason gold can drop $50 or $100 in a very short period without any change in the long-term macro story. They are technical events that clear out 'weak hands' rather than fundamental shifts. A trader who only follows the real-rate model might see such a drop as the start of a new bear trend, whereas a trader who watches open interest and COT data will recognize it as a healthy clearing of leveraged positions, often setting the stage for the next leg higher. In the current regime, these washouts have become increasingly shallow and short-lived, as the underlying physical bid quickly steps in to absorb the liquidated paper positions.
- Managed Money: The fast-money speculators who drive the short-term real-rate correlation.
- Commercials: The hedgers who provide the counterpart to speculators, often caught in squeezes.
- Open Interest: The 'fuel' in the tank—high levels indicate a crowded trade, low levels indicate room to run.
- Positioning Washout: Sudden sell-offs that clear out leveraged traders without changing the macro trend.
- Short Covering: Violent but temporary rallies driven by the exit of pessimistic traders.
The allocator's dilemma: Gold in a multi-asset framework
For professional money managers—those running pension funds, endowments, and multi-asset portfolios—gold is rarely held as a speculative bet. Instead, it is used as a tool for portfolio construction, and the real-rate framework is the primary way they size their positions. The 'allocator’s dilemma' arises when the traditional correlations that define these models break down. Historically, gold was a 'zero-duration' asset that provided a hedge against inflation and a diversifier against equities. In a classic 60/40 portfolio, gold was the 'third leg of the stool.' When real rates rose, allocators would typically reduce their gold weighting in favor of bonds, which now offered a better yield for a similar level of perceived safety. The post-2022 period, however, has fundamentally challenged this logic, as bonds have failed to provide the necessary protection during periods of high inflation.
The experience of 2022 changed the calculus for many institutions. In that year, both stocks and bonds fell sharply as inflation spiked and rates rose. The traditional 60/40 portfolio suffered its worst year in decades because the 'diversifier' (bonds) failed at the exact moment it was needed most. Gold, by contrast, remained relatively stable and eventually outperformed both asset classes. This led many allocators to reassess the role of gold in their framework. It was no longer just a 'yield-sensitive' asset; it was a 'tail-risk' hedge that could protect against the simultaneous failure of stocks and bonds. This shift in perception has led to a structural re-allocation toward gold, where managers are willing to hold the metal even when real rates are high, simply because they no longer trust bonds to provide the necessary diversification in a world of high fiscal deficits and structural inflation.
Sizing a gold position in a modern multi-asset framework involves more than just a real-rate forecast. Managers use 'risk-budgeting' models, where the allocation is determined by gold's volatility and its correlation to other assets in the portfolio. Because gold's correlation to equities has remained low even as its correlation to real rates has broken, it has become a more efficient diversifier for many portfolios. A 5% or 10% allocation to gold can significantly improve the 'Sharpe ratio' of a portfolio, even if gold's expected return is zero, by reducing the overall drawdown during market crises. In this context, the 'real rate' is just one input in a complex optimization problem. The fact that gold has held its ground despite high rates makes it even more attractive to these managers, as it suggests the metal has 'idiosyncratic' strength that paper assets lack.
There is also a growing distinction between 'paper' and 'physical' allocation among institutional investors. Many are moving away from gold ETFs—which are easy to trade but carry counterparty risk and are heavily influenced by speculative flows—and toward 'allocated physical' gold held in private, non-bank vaults. This shift reflects a desire to exit the financial system entirely for a portion of their reserves, treating gold as a form of 'monetary insurance' rather than just a trading vehicle. This 'un-systemic' demand is fundamentally different from the macro-hedge demand of the past. It is a long-term, strategic move that is not affected by the monthly ups and downs of the TIPS yield. For these allocators, the real-rate framework hasn't broken; it has simply been superseded by a more urgent need for systemic resilience and a return to tangible, un-sanctionable assets.
60/40 failure
When bonds and stocks fall together, gold's diversifying power is most valuable
Zero duration
Gold's lack of sensitivity to interest rate duration compared to bonds
Tail-risk hedge
Protection against extreme systemic events rather than daily price noise
Structural shift
The transition from speculative ETFs to permanent physical bullion holdings
How to use the framework now
The right conclusion is not that real rates no longer matter. It is that they were never the only thing that mattered, and that for fifteen unusually stable years nothing else moved enough to be visible. When a second large term entered the equation—the strategic, non-yield-sensitive bid from central banks and the structural physical demand from the East—the single-variable model failed in the way single-variable models always do. It forgot that the world is bigger than the US Treasury market and that 'safety' is a relative concept. The framework is not 'broken'; it is simply 'incomplete.' A modern analyst must now balance the opportunity-cost signal of the bond market against the geopolitical-risk signal of the official sector, treating each as a separate but equally important driver of the gold price.
A practical reading treats real yields as the term governing the 'cost' of the position and the official sector as the term governing the 'size' of the underlying bid. High real yields still make gold expensive to hold; they simply cannot force the price down while a buyer with different objectives is absorbing every ounce of available supply. Think of real rates as the 'wind' and structural demand as the 'tide.' The wind can blow against the tide, creating choppy water and temporary price pullbacks, but the tide will ultimately determine where the ship ends up. In the current era, the tide of reserve diversification and systemic fear is running strong, and it is more than capable of overcoming the headwind of positive real interest rates. Navigating the market requires watching both the wind and the tide, without mistaking one for the other.
It also suggests where the framework would reassert itself. If official purchases slowed materially while real yields stayed high, the old relationship would have room to work again. Whether that happens is a question about geopolitics and reserve policy rather than about monetary economics—which is, in the end, the honest summary of what the past four years taught the gold market. The metal has reclaimed its role as the 'ultimate barometer,' not just of inflation or interest rates, but of the global order itself. To trade gold today is to trade a view on the future of the dollar, the stability of the Western financial system, and the shifting balance of power between East and West. No single yield screen can capture all of that, and the most successful investors will be those who can integrate these disparate signals into a unified and resilient macro thesis.
Frequently asked
Questions readers ask
- What is a real interest rate?
- The nominal yield on a bond minus expected inflation over the same horizon. In markets it is usually read off inflation-linked government bonds — US Treasury Inflation-Protected Securities for the ten-year benchmark — because those instruments quote a real yield directly rather than requiring an inflation forecast.
- Why should real rates matter to gold at all?
- Gold produces no income. Holding it costs the return you gave up by not holding an equally safe asset that does pay. When the inflation-adjusted return on that safe asset is negative, the cost of holding gold is negative too, and the metal becomes comparatively attractive. When real yields are high and positive, the opposite applies.
- Did the relationship actually break, or is it just noisy?
- Rolling correlations between the gold price and ten-year real yields, strongly negative for most of the previous fifteen years, fell towards zero and at times turned positive after 2022. That is a larger and longer deviation than the ordinary noise of the preceding period, though it is not evidence that the mechanism has disappeared.
- What replaced real rates as the dominant driver?
- No single variable. The best-supported account combines sustained central-bank purchases, reserve managers reassessing the safety of foreign-currency claims, and steady physical demand in India, China and the Gulf that does not respond to Western real-yield screens.
- Does a strong dollar always mean a weaker gold price?
- Not always. Gold is quoted in dollars, so mechanically a stronger dollar makes the metal dearer elsewhere and tends to weigh on the price. But both can rise together when the driver is a flight to safety rather than a shift in relative interest rates.
- Do exchange-traded fund flows drive the price or follow it?
- Mostly they follow. Fund holdings are a good real-time reading of Western investor conviction, and large redemptions can amplify a move, but through the 2022-2024 period the price rose while holdings fell — which is precisely why analysts started looking at the official sector instead.
- Is there a real-yield level at which gold reliably falls?
- No durable threshold has held across cycles. Attempts to fit one usually work in-sample and fail out-of-sample, because the level of real yields matters less than what is happening to the credibility of the assets those yields are attached to.