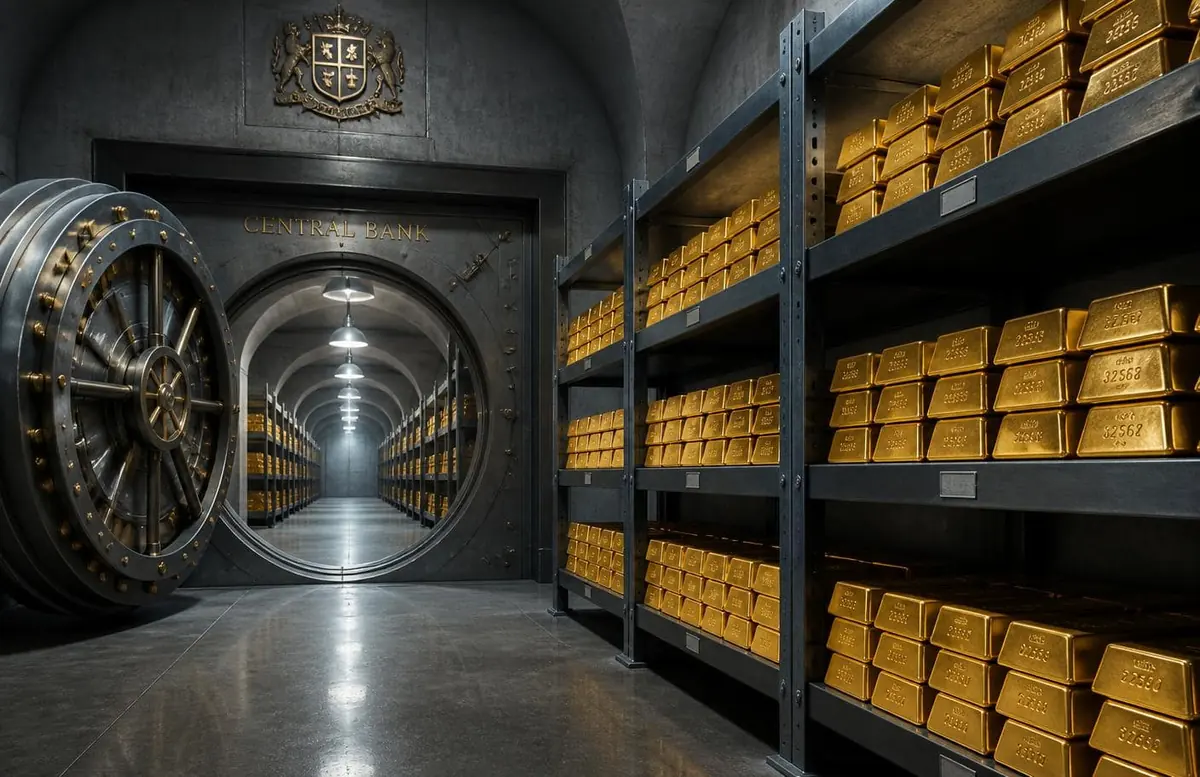
Market Structure
Who Actually Sets the Gold Price
There is no single gold price. There is a London settlement number, a New York futures curve, a Shanghai premium and a jeweller's counter in Dubai — and the distance between them is where the market lives.
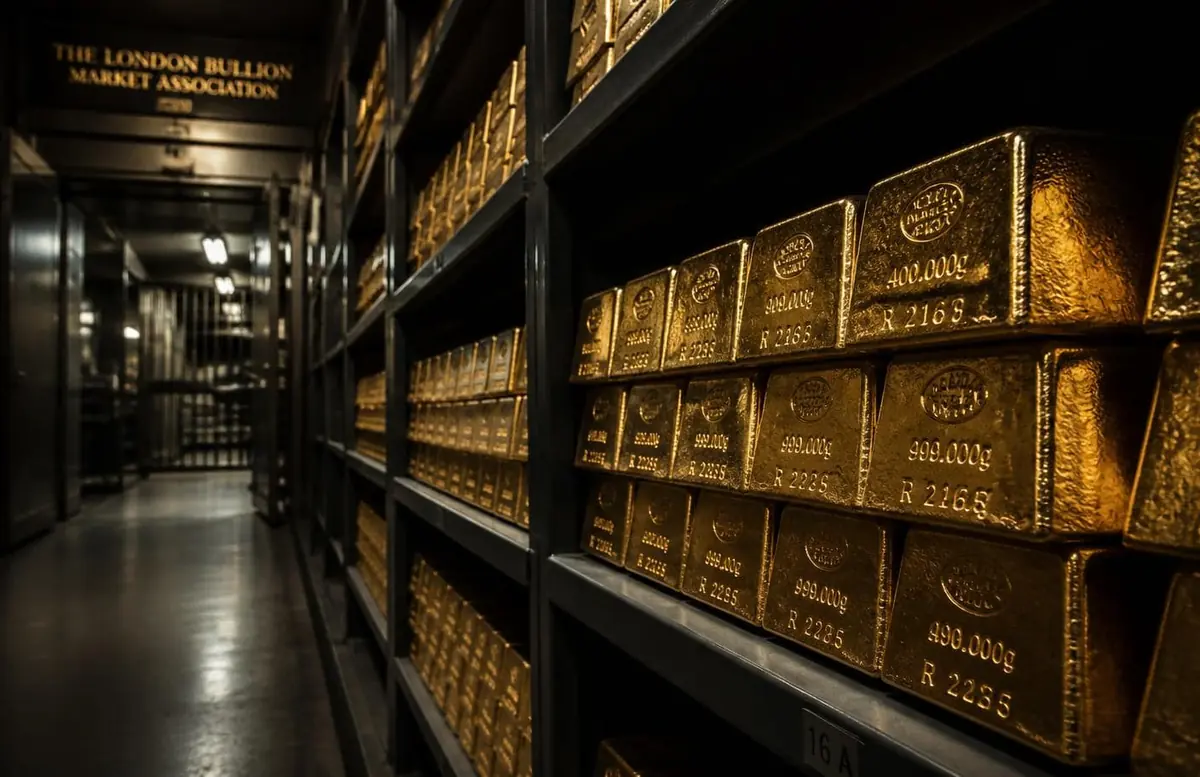
The first thing to understand about the gold price is that the phrase is a convenience. There is a number on the screen and it moves and it is reported as though it were a fact of nature, in the way a temperature is a fact. It is not. It is the output of a specific market, in a specific place, in a specific form of the metal, under a specific set of settlement conventions — and if you change any one of those variables the number changes with it.
The number almost always means this: an ounce of gold, of Good Delivery quality, held unallocated in a London vault, for settlement two business days forward, quoted in United States dollars. That is what 'spot' means in bullion. Every other price in the gold economy is that price plus or minus the cost of turning it into something else — a coin, a wire, a futures contract, a bar sitting in a bonded warehouse in Hong Kong.
London: the market that is not an exchange
The centre of the wholesale gold market is not a trading floor. It is a network of banks, brokers and vault operators dealing directly with each other over the counter, settling through a clearing system among a handful of members, with the London Bullion Market Association writing the standards everybody agrees to be bound by. There is no central order book. There is no public tape. What there is instead is a set of shared definitions — the Good Delivery bar, the loco London convention, the unallocated account — that make one bank's promise interchangeable with another's.
Good Delivery is the load-bearing standard. A bar must weigh between roughly 350 and 430 troy ounces, be at least 995 parts per thousand fine, carry the stamp of an accredited refiner, and have a serial number and a shape a vault crane can handle. Meet those conditions and the bar is fungible across the entire wholesale market. Fail one and it is metal, but it is not money.
Most trading never touches a bar at all. Unallocated gold — a claim on a bank for a quantity of metal, rather than title to specific serial-numbered bars — is the working currency of the market, because it can be transferred by ledger entry in seconds where physical movement takes days, armoured trucks and insurance. Allocated gold, where a client owns identified bars sitting outside the bank's balance sheet, costs more to hold precisely because it cannot be lent, netted or re-used.
The auction: a benchmark, not a market
Twice a day, at 10:30 and 15:00 London time, an electronic auction runs to establish a single printed benchmark. Participants submit buying and selling interest at a proposed price; if the imbalance is too large the price is adjusted and another round runs, typically resolving in a handful of rounds and a few minutes. The result is published as the LBMA Gold Price.
The benchmark exists because an enormous volume of contracts needs a defensible reference number: refinery supply agreements, mine hedges, jewellery wholesale terms, fund valuations. What it is not is the place where the price is discovered. Discovery happens continuously, all day, across the London over-the-counter market and the futures pit. The auction is the moment the market writes down where it already is.
This distinction was blurred badly in public understanding by the older fixing arrangement, in which a small group of banks conducted the process by telephone. That system was replaced after regulatory scrutiny with an electronic, auditable, wider-participation auction. The reform is real, and the criticism that produced it was warranted. But the reform did not change the structural fact that the benchmark is downstream of the market rather than upstream of it.
“People ask who sets the price, expecting a room. The honest answer is a spread: London funding on one side, New York futures on the other, and a freight quote in between.”
New York: leverage, liquidity and the EFP
COMEX in New York is the other half of the price-forming machine. It is a futures exchange: standardised contracts, central clearing, published volumes, and a settlement date in the future rather than in two days. Because a futures position requires margin rather than the full value of the metal, it is the cheapest way to take a large directional view on gold, and it is where most speculative money expresses itself.
The two markets are tied together by the exchange for physical spread — the price of swapping a futures position for the equivalent London spot position. In ordinary conditions the EFP is a quiet number reflecting little more than dollar interest rates and vault costs over the contract's life. It is one of the most reliable stress indicators in the entire commodity complex, because it prices something that is normally free: the ability to move metal from one jurisdiction to another.
In March 2020 that ability disappeared. Refineries in Ticino closed under lockdown orders; passenger aviation, which carries a surprising share of the world's bullion in the holds of scheduled flights, largely stopped. London had metal in the wrong bar size and New York had contracts demanding delivery of the right one. The spread widened to levels that made no sense as a financing cost and perfect sense as a logistics failure. Reporting at the time described this as a market breaking. It was closer to a supply chain briefly telling the truth about itself.
400 oz
Nominal London Good Delivery bar — the wholesale unit
100 oz
COMEX deliverable bar — a different casting entirely
T+2
Standard loco London spot settlement
2×/day
LBMA benchmark auctions, 10:30 and 15:00 London
The demand side has four different clocks
Ask why the price moved and you will usually be handed a single explanation. In practice four distinct buyer types operate on incompatible timescales, and most confusing price action is one of them overriding the others.
- Central banks and official institutions: slow, strategic, largely price-insensitive, and reported with a lag. Reserve managers do not chase rallies; they execute multi-year allocations.
- Exchange-traded funds: fast and reflexive. Fund inflows buy metal, which supports the price, which attracts more inflows, until the direction reverses and the mechanism runs backwards just as efficiently.
- Jewellery and craft demand: seasonal, culturally scheduled and highly price-elastic. Indian wedding-season buying and Chinese New Year restocking are calendar events, and they shrink when prices spike.
- Industrial and technology demand: small in tonnage, almost perfectly price-inelastic, because the gold content of a connector is trivial next to the cost of a device failing.
Supply is even less responsive than a reader might assume. Mine output cannot be raised quickly at any price: a new deposit takes a decade or more from discovery to first pour, and an operating mine's grade is set by geology, not by ambition. The variable that actually flexes in the short run is recycling. When the price rises sharply, old jewellery comes out of drawers and into refineries within weeks, which is why scrap flows are one of the better real-time indicators of how a price move is being received by the people who own the most gold in aggregate — households.
Regional premiums are information, not noise
The Shanghai Gold Exchange price frequently sits above or below the international level. Mumbai carries its own spread, as does Istanbul, as does Dubai. These gaps are sometimes reported as evidence that the global price is fictional. They are better read as the cost of the last mile: import duty, licensing, local funding rates, exchange delivery requirements, and whatever the freight and insurance market charges that month for flying tonnes of metal into a specific airport.
Read that way, a persistent Shanghai premium is a demand signal, and a persistent discount is a saturation signal. Traders who watch the physical market treat these numbers as one of the few honest, unmodelled inputs available, precisely because they cannot be produced by sentiment. Somebody has to actually pay the premium and take the bar.
The practical upshot
The gold price is not handed down. It is assembled, continuously, from the interaction of a London credit-and-vault system, a New York leverage venue, a set of regional physical markets with their own frictions, and a demand base whose components disagree with each other by design. The screen number is a summary of that assembly, accurate for one form of the metal in one place at one moment.
Which is why the most useful question is rarely 'what is gold worth'. It is 'which gold, where, settled how, and who is on the other side'. Answer those four and the price stops being a mystery and becomes what it actually is: an accounting identity with a lot of logistics attached.
Lease rates, forwards and the tightness signal nobody quotes on the news
Beneath the spot price sits a smaller, quieter market that most coverage never mentions: the market for borrowing and lending physical gold itself. A refiner who has sold metal forward but has not yet received the doré to make it, or a jeweller who needs bars on the shelf before a festival but has not yet been paid for the previous season's stock, can borrow gold from a bullion bank against a fee. That fee is the lease rate, and it behaves like an interest rate on the metal rather than on cash.
Why the rate spikes before the price does
In ordinary conditions the lease rate is low and stable, because plenty of holders are willing to part with metal for a modest fee, confident they can get it back or replace it easily. It spikes when holders become reluctant — when large allocated positions are being held tightly rather than made available, often because those holders suspect a supply interruption or a squeeze is coming. Because leasing activity is wholesale and largely invisible to retail participants, a rising lease rate is one of the few genuinely leading indicators in the gold market, arriving before the tightness shows up as a widening premium or a jump in the spot number itself.
The related concept is the gold forward offered rate, which prices the cost of swapping gold for dollars and back again over a fixed term. A negative or sharply falling forward rate tells you that holders would rather have physical gold in hand than the dollars they could earn by lending it out — a distinctly different signal from a currency market forward curve, and one that specialist desks watch far more closely than most financial coverage credits them for.
What moves the number in a single trading session
Zoom in from the structural machinery to a single Tuesday and the drivers of a price move are more mundane, and more mechanical, than headlines usually suggest. Algorithmic strategies that trade off moving averages and momentum signals generate a meaningful share of intraday volume in gold futures, and they do not read economic data — they read price action itself, which means a move can accelerate purely because it has already started.
- Scheduled US data releases — inflation prints, employment reports, Federal Reserve statements — because they reprice the real interest rate gold is implicitly competing against.
- Options-related flows around large strike levels, where dealers hedging their own exposure can amplify a move as a price approaches a heavily traded strike.
- Currency effects, since gold is priced in dollars globally; a weaker dollar mechanically makes gold cheaper for buyers using other currencies even if the dollar price has not moved.
- Cross-market stress, where a selloff in equities or credit forces funds to raise cash and liquidate profitable positions — including gold — regardless of their view on the metal itself.
- Genuine physical developments, which are rarer than the other four but move the market hardest when they occur: a major refinery outage, an export ban, a central bank disclosing an unusually large purchase.
The historical record: five moments the mechanism was tested
Market structure is easiest to understand through the episodes that stressed it, because ordinary trading days reveal little about where the seams are.
1968: the London Gold Pool collapses
A consortium of central banks spent much of the 1960s selling gold into the market to defend the $35-an-ounce Bretton Woods parity. Sustained deficit spending and rising private demand eventually made the defence unaffordable, and the pool was abandoned in March 1968, splitting the market into an official settlement price between central banks and a free market price for everyone else. It was the first modern demonstration that a fixed gold price and a genuinely free market cannot coexist indefinitely without one giving way.
1980: the peak that took decades to revisit in nominal terms
A combination of double-digit US inflation, the Iranian revolution and the Soviet invasion of Afghanistan drove a short, violent spike that collapsed almost as quickly as it formed. The episode is a standing reminder that a rapid price surge driven by acute fear tends to be a poor predictor of where the price settles once the acute phase passes, and that gold's volatility during genuine crises is frequently underestimated by observers used to its longer calm stretches.
1999: the Washington Agreement
European central banks, worried that uncoordinated selling by individual members was depressing the price they were all trying to realise on their own reserves, agreed to cap and coordinate sales. It is a rare example of central banks explicitly managing their collective market impact, and it marked the beginning of the shift from the official sector as a net seller to, eventually, a net buyer.
2013: the two-day plunge
A concentrated wave of futures selling in April 2013 drove one of the sharpest two-session declines on record, triggering stop-losses that fed the move lower. What followed was instructive: physical premiums in Asia rose immediately as retail and jewellery buyers treated the fall as a buying opportunity, illustrating the split reaction of paper and physical markets to the same event.
1968
Collapse of the London Gold Pool
1980
Post-war nominal price peak, briefly
1999
Washington Agreement on central bank gold sales
2020
COMEX–London EFP dislocation during the pandemic
“Every one of these episodes has the same shape. Something breaks a link that everybody assumed was permanent, the price does something confusing for a short time, and then a new convention quietly replaces the old one.”
Reading a gold price chart like a market-structure reporter, not a chartist
None of this is an argument for technical analysis, which this publication treats with scepticism. It is an argument for reading price moves alongside their plumbing rather than in isolation. A reader who notices a widening EFP, a spike in the lease rate and a rising Shanghai premium in the same week is looking at three independent confirmations that physical gold is becoming harder to move to where it is wanted — a materially more useful observation than a chart pattern, because each of the three numbers is produced by somebody actually transacting rather than by somebody merely predicting.
The discipline this publication tries to model is simple to state and hard to practise: treat the headline number as a summary, not a cause, and go looking for the mechanism underneath it before drawing a conclusion. Almost every confusing gold headline resolves once you ask which of London, New York, Shanghai or the lending market actually moved first.
How the price behaves around monetary policy decisions
No recurring event moves the gold price as reliably as a Federal Reserve interest-rate decision, and the mechanism is worth stating plainly because it is so often skipped over in favour of a headline reaction. Gold pays no coupon and no dividend, so the cost of holding it is entirely an opportunity cost: whatever a safe, interest-bearing alternative would have paid instead. When real, inflation-adjusted yields on government debt rise, that opportunity cost rises with them, and demand for gold as a competing store of value tends to soften. When real yields fall — because inflation expectations climb faster than nominal rates, or because a central bank signals a shift toward cutting — the opportunity cost falls and gold tends to firm.
The relationship is a strong tendency, not a formula, and readers should resist the temptation to treat it as one. It has broken down conspicuously at moments when investors doubted the safety of government bonds themselves rather than merely their yield, because in that scenario gold and bonds stop being substitutes and start being answers to different fears. It has also been overridden for extended periods by central bank buying and by currency effects large enough to swamp the real-rate relationship entirely. Traders who treat the correlation as gospel are eventually surprised by it; traders who treat it as the single most useful starting hypothesis, to be discarded when the data contradicts it, tend to do better.
“Real yields explain most of gold's move most of the time. The interesting reporting is always in the minority of cases where they don't, because that is where you learn what people are actually afraid of.”
The role of the US dollar, and why it is not the whole story
Because gold is priced globally in US dollars, a weaker dollar mechanically makes a fixed quantity of gold cheaper for anyone transacting in another currency, which tends to draw in additional buying from those markets and push the dollar price higher — a feedback loop that gets called the 'dollar effect' in trading-desk shorthand. It is real, it is measurable, and it explains a meaningful share of day-to-day co-movement between the dollar index and gold.
It is not, however, a complete theory of gold's price, and treating it as one leads to bad forecasts. Gold has risen and fallen in tandem with the dollar for extended stretches when both were being driven by the same underlying force — a shift in global risk appetite, for instance — rather than one causing the other. The honest position is that dollar strength is a headwind for gold at the margin, all else equal, and that all else is very rarely equal for very long.
Central bank buying: the slowest and least discussed driver
Official-sector demand deserves more attention than it typically receives in day-to-day market commentary, precisely because it does not behave like the rest of the demand base. Central banks disclose reserve changes on a lag, sometimes a substantial one, and they are executing multi-year strategic reallocations rather than reacting to a headline. A reserve manager adding to a gold position is not trying to time a rally; they are typically responding to a slower-moving judgement about currency concentration risk, the sanctionability of foreign-currency reserves, or a long-run view on the composition of a reserve portfolio that has nothing to do with this week's inflation print.
- Official purchases are reported with a lag through national disclosures and aggregated by international bodies, so real-time central bank buying is inferred rather than observed directly.
- Reserve diversification away from a small number of major currencies has been a stated objective for several large emerging-market reserve managers over the past decade.
- Central bank gold sits largely outside the leased, unallocated wholesale pool that supports day-to-day market liquidity, which is one reason large official purchases can tighten physical availability even when the headline price barely reacts.
- Because the buying is strategic rather than tactical, it tends to continue through periods when private investors are reducing exposure, acting as a partial stabiliser rather than an amplifier of price swings.
How this reporting differs from investment advice
It is worth restating plainly, given how often market-structure reporting gets mistaken for a trading signal: nothing in this piece, or in this publication generally, recommends buying, selling or holding gold in any form. Explaining that real yields matter is not a forecast of where real yields are going. Explaining that central banks have been net buyers for a decade is not a claim that they will remain so. The purpose of this reporting is to make the mechanism legible enough that a reader encountering a confusing headline about the gold price can work out for themselves which part of the machine moved, rather than accepting whichever explanation was offered first.
Lagged
Basis on which most official-sector gold purchases are disclosed
Multi-year
Typical horizon of a reserve manager's strategic gold allocation
Real yields
Single most cited macro driver of gold price direction by desks
Days–weeks
Typical horizon over which ETF flows react to a single data print
Frequently asked
Questions readers ask
- Is there one official gold price?
- No. The number quoted in the press is usually the spot price for unallocated gold held in London vaults, expressed in US dollars per troy ounce. The LBMA Gold Price auction produces a separate benchmark twice each London business day, used to settle contracts. Futures on COMEX trade at a different level again because they include financing and storage to a future delivery date.
- Why is the price I pay for a coin higher than the spot price?
- Because spot is a wholesale price for 400-ounce bars that never leave a vault. A retail coin adds refining, minting, insured transport, dealer inventory cost, VAT or sales tax where applicable, and a margin. On small denominations that stack can be a double-digit percentage of the metal value.
- What is the EFP and why do traders watch it?
- The exchange for physical spread is the price difference between COMEX futures and loco London spot. It is normally a small, stable financing cost. When it blows out — as it did in March 2020 when passenger flights stopped and bars could not be moved to New York — it is telling you that physical metal cannot travel, not that the market has mispriced risk.
- Does the Shanghai premium mean the price is wrong?
- No. It means the cost of getting an internationally accepted bar into a market with import licensing, a domestic exchange and its own demand cycle is not zero. Premiums and discounts on the Shanghai Gold Exchange are a readable signal of Chinese physical demand rather than evidence of arbitrage failure.
- What is the gold lease rate and why does it matter?
- It is the rate a bullion holder charges to lend metal to a borrower who needs physical gold temporarily, typically a refiner or jeweller bridging inventory. When lease rates rise sharply, it usually means holders of allocated metal are reluctant to part with it, which is a physical tightness signal that tends to arrive before it is visible in the spot price itself.
- Why do gold and real interest rates usually move opposite ways?
- Gold pays no coupon, so its opportunity cost rises when safe assets pay more. When inflation-adjusted yields on government bonds climb, holding gold instead of those bonds costs more in forgone income, which tends to weigh on demand. The relationship is a strong tendency rather than a law, and it breaks down during episodes where investors doubt the safety of the bonds themselves.